Notes on Oxygen Cascade and Hemoglobin Dissociation Curve
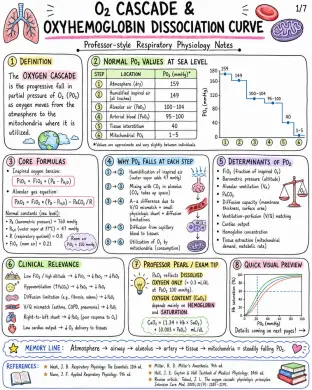
Oxygen cascade and oxyhemoglobin dissociation curve notes covering PO₂ values, A–a gradient, P50, curve shifts, oxygen content, delivery, and clinical physiology. Definition: - The oxygen cascade is the progressive fall in partial pressure of O2 (PO2) as oxygen moves from the atmosphere to the mitochondria where it is utilized. Normal PO2 Values at Sea Level: - Atmosphere (dry): 159 mmHg - Humidified inspired air (at trachea): 149 mmHg - Alveolar air (PAO2): 100-104 mmHg - Arterial blood (PaO2): 95-100 mmHg - Tissue interstitium: 40 mmHg - Mitochondrial PO2: 1-5 mmHg Core Formulas: - Inspired oxygen tension: PIO2 = FIO2 x (PB - PH2O) - Alveolar gas equation: PAO2 = FIO2 x (PB - PH2O) - PaCO2 / R Why PO2 Falls at Each Step: - Humidification of inspired air (water vapor adds 47 mmHg) - Mixing with CO2 in alveolus (CO2 takes up space) - A-a difference due to V/Q mismatch + small physiologic shunt + diffusion limitations - Diffusion from capillary blood to tissues - Utilization of O2 by mitochondria (consumption) Determinants of PO2: - FIO2 (fraction of inspired O2) - Barometric pressure (altitude) - Alveolar ventilation (VA) - PaCO2 - Diffusion capacity (membrane thickness, surface area) - Ventilation-perfusion (V/Q) matching - Cardiac output - Hemoglobin concentration - Tissue extraction (mitochondrial demand, metabolic rate) Clinical Relevance: - Low FIO2 / high altitude → ↓PO2 → ↓PAO2 → ↓PaO2 - Hypoventilation (↑PaCO2) → ↓PAO2 → ↓PaO2 - Diffusion limitation (e.g., fibrosis, edema) → ↓PaO2 - V/Q mismatch (asthma, COPD, pneumonia) → ↓PaO2 - Right-to-left shunt → ↓PaO2 (poor response to O2) - Low cardiac output → ↓O2 delivery to tissues Professor Pearl / Exam Tip: - PaO2 reflects DISSOLVED OXYGEN ONLY (≈ 0.3 mL/dL at PaO2 100 mmHg). Oxygen content (CaO2) depends mainly on HEMOGLOBIN and SATURATION. CaO2 ≈ (1.34 x Hb x SaO2) + (0.003 x PaO2) mL/dL Image 2: Alveolar Gas Equation: - On room air at sea level: PAO2 = FiO2 (PB - PH2O) - PaCO2/R - Typical PAO2 ≈ 100 mmHg on room air at sea level A-a Gradient: - A-a gradient = PAO2 - PaO2 - Normal young healthy adult: ≈ 5-15 mmHg - Age-adjusted approximation: ≈ age/4 + 4 - A widened A-a gradient suggests: V/Q mismatch, diffusion limitation, right-to-left shunt Causes of Hypoxemia: Quick Comparison: - Low FiO2: - A-a Gradient: Normal - Response to Supplemental O2: Good - Common Examples: High altitude, high FiO2 need (e.g., inhaled gas mix) - Hypoventilation: - A-a Gradient: Normal or slightly ↑ - Response to Supplemental O2: Good - Common Examples: COPD exacerbation, CNS depression, neuromuscular disease - Diffusion Limitation: - A-a Gradient: ↑ Widened - Response to Supplemental O2: Good - Common Examples: Pulmonary fibrosis, pulmonary edema, interstitial lung disease - V/Q Mismatch: - A-a Gradient: ↑ Widened - Response to Supplemental O2: Good to fair (most cases) - Common Examples: Asthma, COPD, pneumonia, pulmonary embolism - Right-to-Left Shunt: - A-a Gradient: ↑↑ Markedly widened - Response to Supplemental O2: Poor (minimal) - Common Examples: ARDS, atelectasis, intrapulmonary shunt, congenital heart disease Why PaCO2 Influences PAO2 Inversely: - From alveolar gas equation: PAO2 = FiO2 (PB - PH2O) - PaCO2/R - ↑ PaCO2 → subtracts more → ↓ PAO2 - ↓ PaCO2 → subtracts less → ↑ PAO2 - Ventilate to lower PaCO2 → raise PAO2 Response to Oxygen Therapy: - Good response in: Low FiO2 (e.g., altitude), hypoventilation, diffusion limitation, most V/Q mismatch - Poor response in: Large right-to-left shunt (e.g., ARDS, atelectasis) Alveolus-Capillary Unit & Mechanisms: - Alveolus: PAO2 ≈ 100 - Capillary: PaO2 ≈ 95 Professor Pearl: - Do not confuse hypoxemia (low PaO2) with: - Low oxygen content (low CaO2) - Low tissue oxygen delivery (DO2) - They are related, but not the same! Memory Line: - Low PaO2? Think FiO2, ventilation, diffusion, V/Q mismatch, or shunt. Image 3: Definition: - The oxyhemoglobin dissociation curve depicts the relationship between the partial pressure of oxygen (PO2) and the percentage saturation of hemoglobin (SaO2) in blood. Why Sigmoid? - Hemoglobin (Hb) is a tetramer (4 subunits). - O2 binding is cooperative. - Binding of one O2 increases affinity of remaining sites. - Transition from low-affinity T-state → high-affinity R-state. Basic Oxyhemoglobin Dissociation Curve (Normal): - PO2 100 mmHg ≈ SaO2 97-100% (Arterial blood) - PO2 60 mmHg ≈ SaO2 ~90% - PO2 40 mmHg ≈ SaO2 ~75% - PO2 27 mmHg (P50) ≈ SaO2 50% Flat Upper Portion (High PO2: ~60–100 mmHg): - Curve is flat in lungs. - Hb is near fully saturated. - Protects SaO2 from modest drops in PO2. - Ensures stable loading in the alveoli. P50 (Point of 50%): - PO2 at which Hb is 50% saturated. - Normal value: P50 ≈ 26–27 mmHg - ↑ P50 → RIGHT SHIFT (lower affinity, easier O2 release) - ↓ P50 → LEFT SHIFT (higher affinity, harder O2 release) Clinical Importance: - At PO2 ≈ 60 mmHg, SaO2 ≈ 90%. - Classic exam threshold. - Below this, SaO2 falls rapidly with small drops in PO2 (steep part). - Above this, SaO2 is relatively stable on the flat part. Dissolved O2 vs Hb-Bound O2: - DISSOLVED O2: - Form: Physically dissolved in plasma - Capacity: Very low (~0.3 mL O2/dL blood) - Transport: Proportional to PO2 - Function: Immediate availability - Example at PO2 100 mmHg: ~0.3 mL O2/dL - Hb-BOUND O2: - Form: Chemically bound to hemoglobin - Capacity: High (~20 mL O2/dL blood) - Transport: Follows dissociation curve - Function: Bulk transport & delivery - Example at PO2 100 mmHg: ~19–20 mL O2/dL Key Takeaway: - The basic O2-Hb dissociation curve explains how blood loads O2 in the lungs and unloads it in the tissues. - Shape is determined by cooperative binding and T R transition. Memory Line: - Flat in the lungs, steep in the tissues = stable loading, efficient unloading. Image 4: Right Shift (↓ affinity for O2): - Factors: • ↑ H+ / acidosis • ↑ PaCO2 • ↑ Temperature • ↑ 2,3-BPG • Exercise • Anemia • Chronic hypoxemia / high altitude - Effect: • ↓ O2 affinity • ↑ P50 • Easier O2 unloading to tissues Left Shift (↑ affinity for O2): - Factors: • ↓ H+ / alkalosis • ↓ PaCO2 • ↓ Temperature • ↓ 2,3-BPG • Fetal hemoglobin (HbF) • Carbon monoxide (CO) • Methemoglobinemia • Stored blood - Effect: • ↑ O2 affinity • ↓ P50 • Impaired tissue unloading Bohr Effect: - ↑ CO2 - ↑ H+ promotes O2 unloading in tissues Haldane Effect: - Deoxygenated Hb carries more CO2 (and H+). - Oxygenation of Hb in the lungs promotes CO2 release. Special Situations: - Condition: • HbF (fetal Hb) • CO poisoning • Methemoglobinemia - Curve Effect: • Left shift • Left shift • Left shift - Why?: • ↓ 2,3-BPG binding • CO binds Hb tightly • Fe3+ cannot bind O2 Oxyhemoglobin Dissociation Curves: - Normal - Right shift - Left shift Clinical Examples: Right Shift (enhanced unloading): - Fever / sepsis - Exercise - Chronic lung disease / COPD - High altitude - Anemia - Metabolic acidosis Left Shift (impaired unloading): - Hypothermia - Alkalosis (respiratory or metabolic) - Carbon monoxide poisoning - Blood stored > 2-3 weeks - Methemoglobinemia - Sepsis (late phase) can evolve to left shift Memory Line: - "CADET, face Right!" - use for RIGHT SHIFT • C: CO2 (↑ PaCO2) • A: Acid (↑ H+) • D: DPG (↑ 2,3-BPG) • E: Exercise • T: Temperature (↑) Image 5: Core Formula: Arterial Oxygen Content - CaO2 = (1.34 x Hb x SaO2) + (0.003 x PaO2) mL/dL - 1.34 mL O2 carried per gram of Hb when fully saturated - 0.003 mL O2/dL/mmHg = dissolved O2 Content, Delivery & Consumption Core Relationships - Mixed venous content: CvO2 = (1.34 x Hb x SvO2) + (0.003 x PvO2) - Oxygen delivery (DO2): DO2 = CO x CaO2 x 10 - Oxygen consumption (VO2): VO2 = CO x (CaO2 - CvO2) x 10 - O2 extraction ratio (O2ER): O2ER = VO2 / DO2 Normal Values - CaO2: 19-20 mL/dL - SvO2: 70-75% - PvO2: ~ 40 mmHg - DO2: 900-1100 mL/min - VO2: 200-250 mL/min - O2 Extraction Ratio (O2ER): ~ 25% Comparing Disorders: Same PaO2 Does Not Mean Same CaO2 or Delivery - Parameter: PaO2 (mmHg), Normal: 80-100 - Parameter: SaO2 (%), Normal: 95-100 - Parameter: CaO2 (mL/dL), Normal: 19-20 - Parameter: Tissue O2 Delivery (DO2), Normal: 900-1100 - Anemia: PaO2 Normal, SaO2 Normal, CaO2 ↓ (due to low Hb), Tissue O2 Delivery ↓ - Hypoxemia: PaO2 ↓, SaO2 ↓, CaO2 ↓ (due to low SaO2), Tissue O2 Delivery ↓ - Carbon Monoxide Poisoning: PaO2 Normal or slightly ↓, SaO2 Normal or slightly ↓ (pulse oximetry may be falsely normal), CaO2 ↓ (Hb occupied by CO), Tissue O2 Delivery ↓ Fick Principle / Tissue Extraction - Tissues extract O2 from blood according to demand - VO2 = CO x (CaO2 - CvO2) x 10 - If DO2 falls → tissues extract more (↑ O2ER) to maintain VO2 - until maxed out - If DO2 falls below critical threshold → VO2 becomes supply dependent Why PaO2 Can Be Normal but Delivery Is Impaired - PaO2 reflects dissolved O2 only - Most O2 is carried by hemoglobin - Anemia → less Hb → less CaO2 even if PaO2 is normal - CO poisoning → Hb is occupied by CO → less O2-carrying capacity even if PaO2 is normal - Therefore, tissues may be under-perfused with O2 despite normal PaO2 Clinical Pearls - Transfusion (↑ Hb) raises CaO2 substantially because it increases the major term (1.34 x Hb x SaO2) - RBCs = more payload capacity - Supplemental O2 raises dissolved O2 (0.003 x PaO2 term). This effect is small unless PaO2 is already low - O2 = helps when hypoxemia is present Visual Formula Map - ↑ Hb or SaO2 → ↑ CaO2 - ↑ PaO2 → slight ↑ in CaO2 (only dissolved O2) - ↑ CaO2 → ↑ DO2 = CO x CaO2 x 10 - ↑ VO2 = CO x (CaO2 - CvO2) x 10 - TISSUE RECEIVES O2 Image 6: High Altitude: - PB ↓ → PIO2 ↓ →